

03.06.2025
QKS Review
QKS Review: The Real State of Semantic Layers and Metrics Stores in BI Platforms
Author:
Madhu Kittur


Executive Summary:
As the Data Analytics and Artificial Intelligence market faces rising pressure from Data Science Integration, Edge Device Integration, Continuous Intelligence, Business Intelligence-as-a-Service, inbuilt data management, verticalization, and other disruptive trends, organizations are moving beyond traditional visualization tools such as Excel and others.
This review blog by QKS Group assesses whether Business Intelligence and Visualization vendors are truly innovating to meet these demands—or merely making incremental updates.
What Modern Business Intelligence and Visualization Platforms Should Deliver:
Today’s platforms must offer more than core features. Critical next-gen capabilities include:
• Self-Service Analytics
• Embedded Analytics
• Copilots for Dashboarding and Storytelling
Key Findings:
The modern BI landscape is being reshaped by the emergence of a centralized semantic layer—a governed, reusable metric store that ensures consistency and trust in analytics outputs. As data complexity and cross-functional demands grow, tools that prioritize API-first architecture, open data modeling, and metrics versioning are becoming essential. Headless BI capabilities, multi-tenant support, and integration with developer workflows (e.g., Git, YAML, dbt) are now key differentiators. Platforms that continue to focus primarily on visual presentation without foundational metric governance are struggling to meet enterprise-grade analytics needs. Centralized metadata management, compatibility with external data tools, and embedded analytics for operational integration are no longer optional—they’re the backbone of scalable BI strategies. Vendors unable to deliver a single version of truth through governed layers risk falling behind as data governance, security, and composability take center stage.
Vendor Classification:
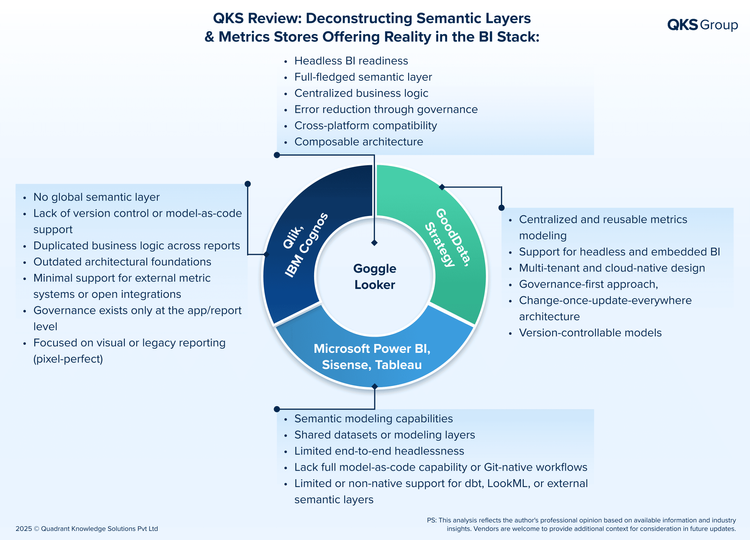
• Leading Vendors: Google Looker, GoodData, Strategy (MicroStrategy) stand out with comprehensive, enterprise-grade solutions.
• Capable Vendors: Qlik, IBM Cognos, Power BI show promise in niche areas but lack breadth or global scale.
• Lagging Vendors: Tableau, Sisense remain focused on outdated features and risk losing relevance.
Introduction:
The Business Intelligence (BI) landscape is undergoing a pivotal shift, increasingly shaped by the emergence of a semantic layer, a centralized metrics store, designed to deliver a consistent and trusted version of the truth across all analytics outputs. This shift is redefining how organizations govern, access, and consume data. Yet not all BI vendors are keeping pace. While the front-runners are embracing API-first, headless architectures to enable composable, governed analytics, others remain focused on surface-level visual appeal prioritizing dashboards over data foundations.
Semantic layer or metrics layer sits between the raw data and end users’ data to translate complex databases into user understandable business terms which can be reused. If this is maintained correctly teams do not have to get confused between terms that draws a same definition. Semantic layer was in talks from long back but the rise of headless BI (using BI purely as a metrics-and-query service via API) and frameworks like dbt have enhanced its everyday use case. Many legacy players like IBM Cognos, SAP BO, MicroStrategy have stressed on this governed approach but new players like Qlik sacrificed it for Agility. But now, since the rise of cyber-attacks consistency and governance are in vogue and vendors have to respond or risk irrelevance of data.
Insight Orchestrators:
The top-tier Business Intelligence (BI) platforms stand out as true Insight Orchestrators vendors that have architected their metrics layer for scale, openness, and governance. These platforms deliver a robust semantic layer that not only safeguards both user-facing and raw data, but also centralizes business logic and data transformation. By prioritizing consistency and control at the data layer rather than focusing solely on visual appeal, they enable trusted, reusable insights across the organization.
Vendors like Google Looker, GoodData, and Strategy leads the way for other vendors in offering Metrics layer. Google’s Looker offers LookML where every measure and dimension is defined once and is used and reused across all dashboards without being encumbered by renegading Excel formulas or duplicated calculations. Google has prioritized data transformation, business logic, and easy access of data, while still providing visualization, charting, and dashboarding for self-service. Google’s evolution from closed BI to headless BI with an Open SQL Interface and connectors for popular tools enables users to plug into Looker as a governed data source. Looker has several dozen databases that external connectors will work fully with when connected to, including Snowflake, Oracle, Google’s BigQuery and many others. Additionally, the Looker semantic model works with a variety of dialects. Lastly, because of the semantic layer, customers cite a two-thirds deduction in errors when using Looker.
GoodData while smaller in market share has positioned itself as a open semantic layer champion focusing on metrics layer concept, offering headless, API first BI platforms that developers can imbue into any app. GoodData enables users to define the entire semantic model in YAML meaning the business definitions can live in human readable config files which can be managed like any other codebase through GitHub. It is fully multi-tenant and cloud-native making it ideal for product teams embedding analytics into customer-facing apps making it truly headless BI. Additionally, unlike most BI vendors, GoodData isn’t trying to hook you on a fancy UI they’re positioning as an analytics infrastructure provider.
Strategy (MicroStrategy) has been doing centralized metadata and reusable metrics through Semantic Graph since the 90s. These graphs have interconnected attributes and metrics once in centralized metadata repository enabling users to create dashboards by pulling from these definitions, ensuring absolute consistency. Change a metric formula in one place and it updates everywhere a level of single-version-of-truth that modern tools are still trying to emulate. That said, we can categorise Strategy as a tool with complete vision for governed metrics, but weather its delivering for modern buyers depends on if those buyers value governance over ease of use.
Analytics Executors:
The Analytics Executors though have incremental progress towards semantic integrity lack either operational maturity or architectural completeness. Vendors in this section either offer powerful engine but poor governance or have strong modeling layers but are not fit for external consumption. They offer semantic layer which are mostly underused or inaccessible to non native tools making them reliant on process rather than product design.
Vendors like Microsoft PowerBI, Sisense, Tableau fall in this category. PowerBI, though highly popular as Microsoft’s flagship tool known for its ease of use and tight integration with Microsoft stack comes with an underrated semantic capability. PowerBI is powered by Analysis Services, every PowerBI dataset contains tables, relationships, and DAX measures which can be governed and deployed to the PowerBI Service. This enables users to connect many reports and to a single dataset and deliver a centralized metrics model similar to semantic layer. However, PowerBI often asks each analyst to import data and build their own model which is again an double edge sword offering agility but missed single version of truth. This misses PowerBI’s direct integration with tools semantic layer yet, and concepts like Git-based BI dev are not first-class.
Sisense is notable for taking an API-first, code-friendly approach making its software akin to software development than traditional BI. Sisense’s architecture uses an in-memory store called ElastiCube or live database connections, and on top of that is a semantic layer where you define dimensions and measures for dashboards. Sisense has a JavaScript embedding API to integrate its charts in applications, and also a REST API to query data making it a headless engine. For organizations that treat analytics development like software development, this is a massive win where a report change breaks something unknowingly. It’s also perfect for Sisense’s OEM customers who may have multiple deployment tracks for different product versions. In terms of support for external metric definitions like dbt or LookML, Sisense doesn’t natively consume those. It expects you to model data either in its ElastiCube or via SQL in your database and then define the metrics in Sisense.
Tableau transformed the BI industry with its user friendly visual analytics but when it comes to semantic layers and metric store capability it has been a follower and not a leader. Focusing on drag-and-drop ease, tableau left behind the idea of creating a central semantic layer. In 2020, they introduced Logical model, Ask Data, and Metrics but these are incremental and don’t equate to a true metrics layer accessible across tools. Recognizing industry trends, Tableau formed a partnership with dbt Labs in 2022 leveraging dbt’s new semantic layer so Tableau users can query consistent metrics defined in dbt. It gets a higher rank than the remaining tools because at least it’s making moves in the right direction and still offers enterprise features around data source management that the lowest-ranked tools lack.
Dashboard dependents:
Vendors in this group offer limited or superficial semantic capabilities. Their platforms rely on metrics defined within individual reports or dashboards, with no centralized logic, no support for dbt or version control, and minimal integration options. Business logic is duplicated across workspaces, creating risks around inconsistency and error. These tools may perform well in visual exploration or basic reporting, but lack the architectural foundation to support governed, scalable, cross-functional analytics placing them behind in both strategy and execution.
Vendors like Qlik and IBM Cognos take upon this category. Qlik often took different route into BI prominence and claimed its fame through associative in-memory engine which allows users to explore data associations. Due to this application-centric nature of Qlik, it has lagged the creation of semantic layering and metrics store. Qlik follows a common practice of creating a data model within Qlik application where developers can create master items which are essentially the semantic definitions for the app. But to share these definitions across the multiple Qlik app while maintaining consistency is not straightforward, you might have to duplicate the logic in each app or maintain a common script include. In other words, Qlik lacks an out-of-the-box global semantic layer that spans the entire organization’s analytics. Though Qlik lacks in this race, if used rigorously, it can provide a highly consistent experience within each app, and its in-memory engine ensures everyone is looking at the same numbers.
IBM Cognos cynosures around its Cognos Framework Manager which is a classic semantic layer where you define a business oriented model on top of databases, create calculated measures and package them for reusability. However, Cognos has been static since then only offering pixel-perfect reports and legacy dashboards. The main thing is that IBM does not have integration with dbt’s semantic layer or any other for that matter. Additionally, there is very limited Git integration, no support for writing model as code. The bottom line is that the tool once symbolized the importance of a semantic layer is now out of step with the modern semantic layer movement.
Conclusion:
The brutal truth is that, “a beautiful chart with bad data is worse than useless”. If the Business Intelligence (BI) tool does not let users define and reuse the business logic centrally does not only eats up the time but also sets the team on chaos. Organizations no longer tolerate conflicting KPIs across teams and tools. They demand single definition of core metrics at least at the backend regardless of the front end view. This makes it ground level essentiality rather than technical nice-to-have. Enterprises that fail to align their BI strategy around this truth will find themselves building faster toward chaos.
Disclaimer:
This blog is based on independent research and publicly available information. The insights presented reflect the views of QKS Group and are for informational purposes only. While we strive for accuracy, we do not guarantee completeness or absolute correctness. Vendors are welcome to provide clarifications or updates. If any vendor listed in this analysis wishes to provide additional context or clarification, we welcome a briefing call and will consider incorporating relevant updates. This analysis is not intended to disparage any vendor but to provide an informed, balanced perspective. We encourage open and constructive dialogue to foster transparency and a deeper understanding of the industry.
Author: Madhu Kittur, Senior Analyst at QKS Group
Co-Author: Amandeep Singh, Practice Director, and Principal Analyst at QKS Group
Vendors: